This page will show you how to use the Droople App.
You will find some DIY videos and a Quick Start Guide
Instructional video
How to create client and provision a new user
How to use the Droople App
Accessing the App
To access the app on your desktop computer or smartphone, open your internet browser and go to https://app.droople.com.
You are then prompted to log in or to create an account if you do not already have one.
How to create an account ?
To create an account click on Create an account. Then enter your basic contact details and set up your password. Finally, verify your account using the code sent to your email address.

After logging in, you will be redirected to your asset’s Dashboard.
Client Management
The platform gives you the ability to create different levels of ownership if you have multiple clients that need to have access to some assets that belong to them but which are also under your management.
For example, you are managing three coffee machines that are installed at three different clients and these clients also need access to their coffee machine, then it is possible to create “child” clients (your clients) under one “parent” account (your account).
How to do that?
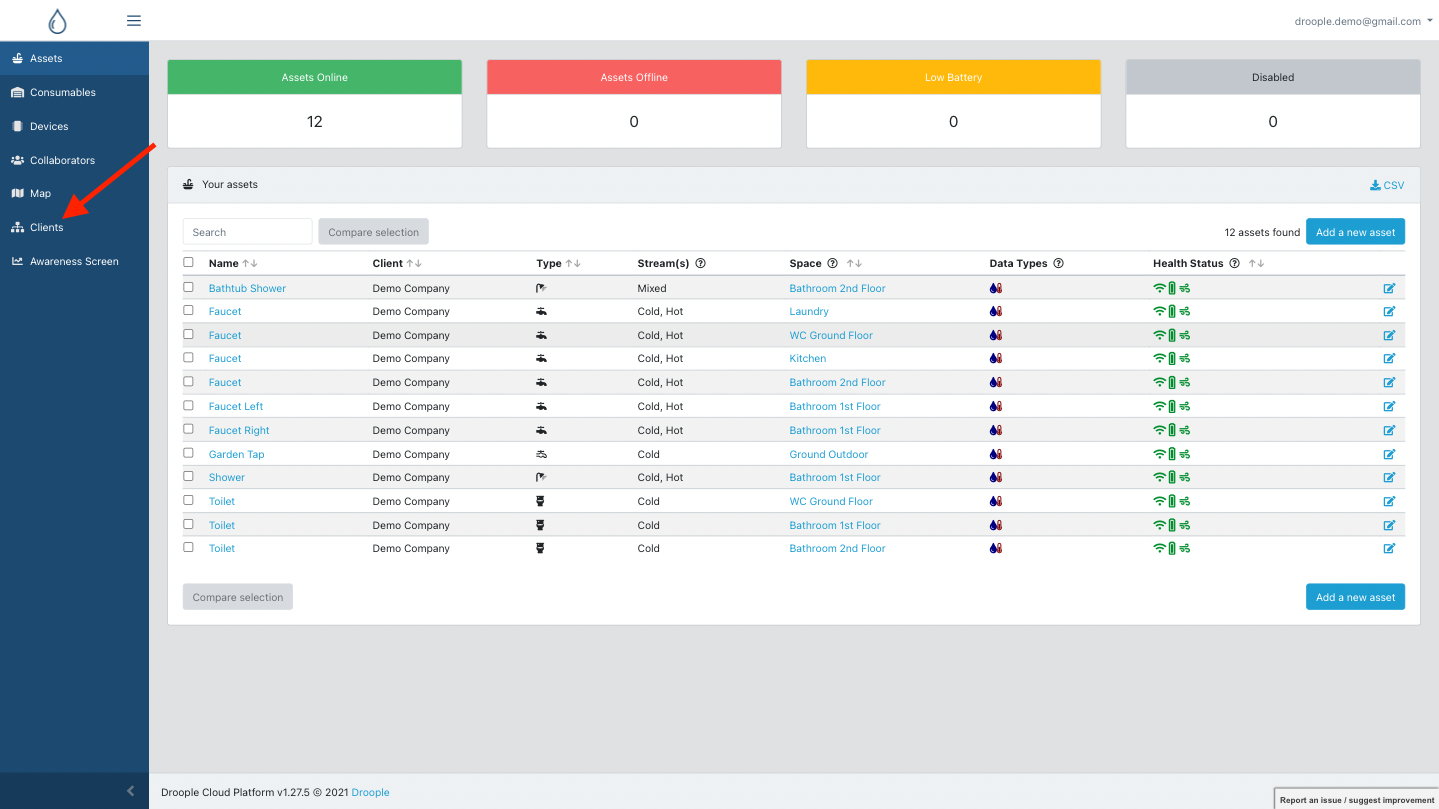
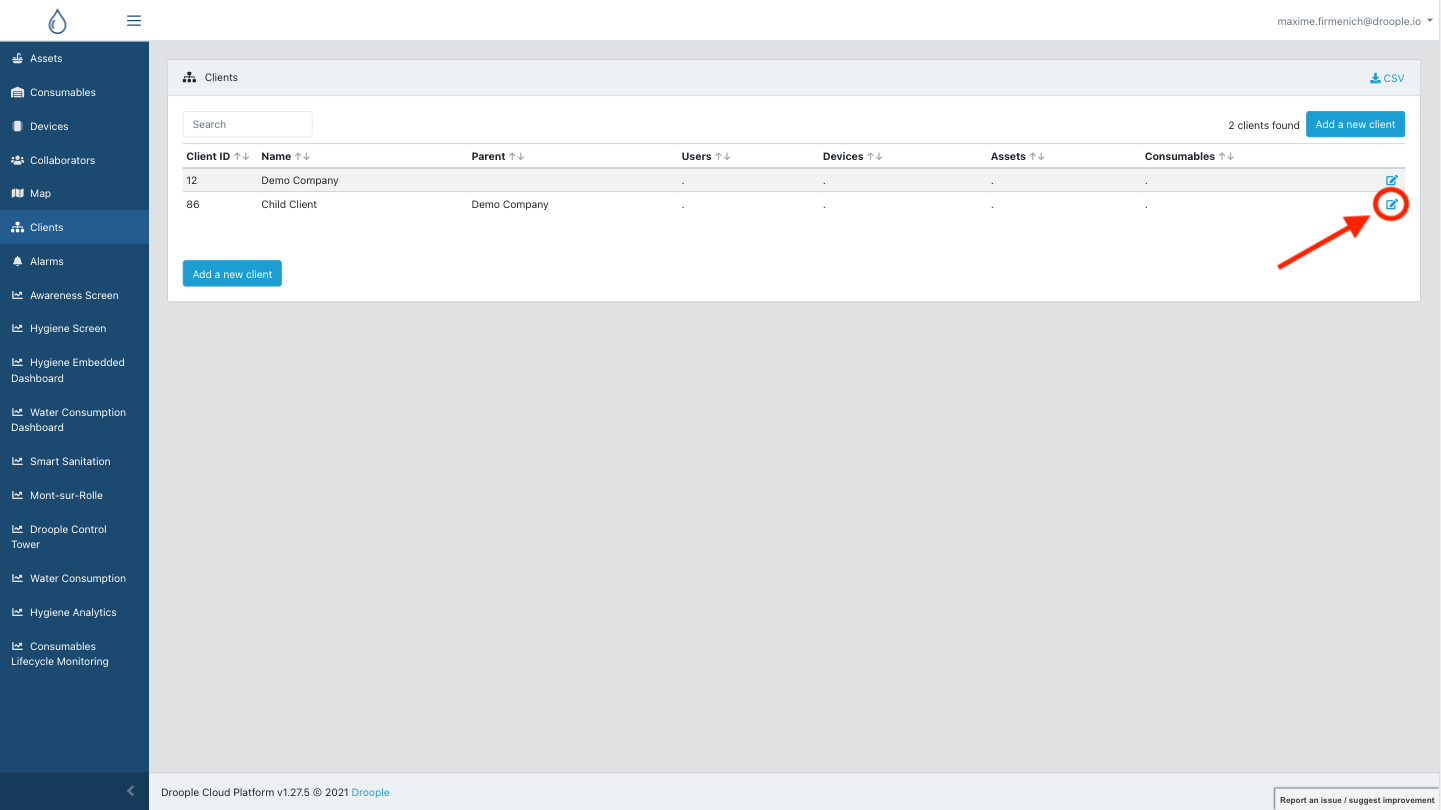
First, you need to log in to your account. Then, once on the landing page, click on the “Client” tab on the left of your screen.
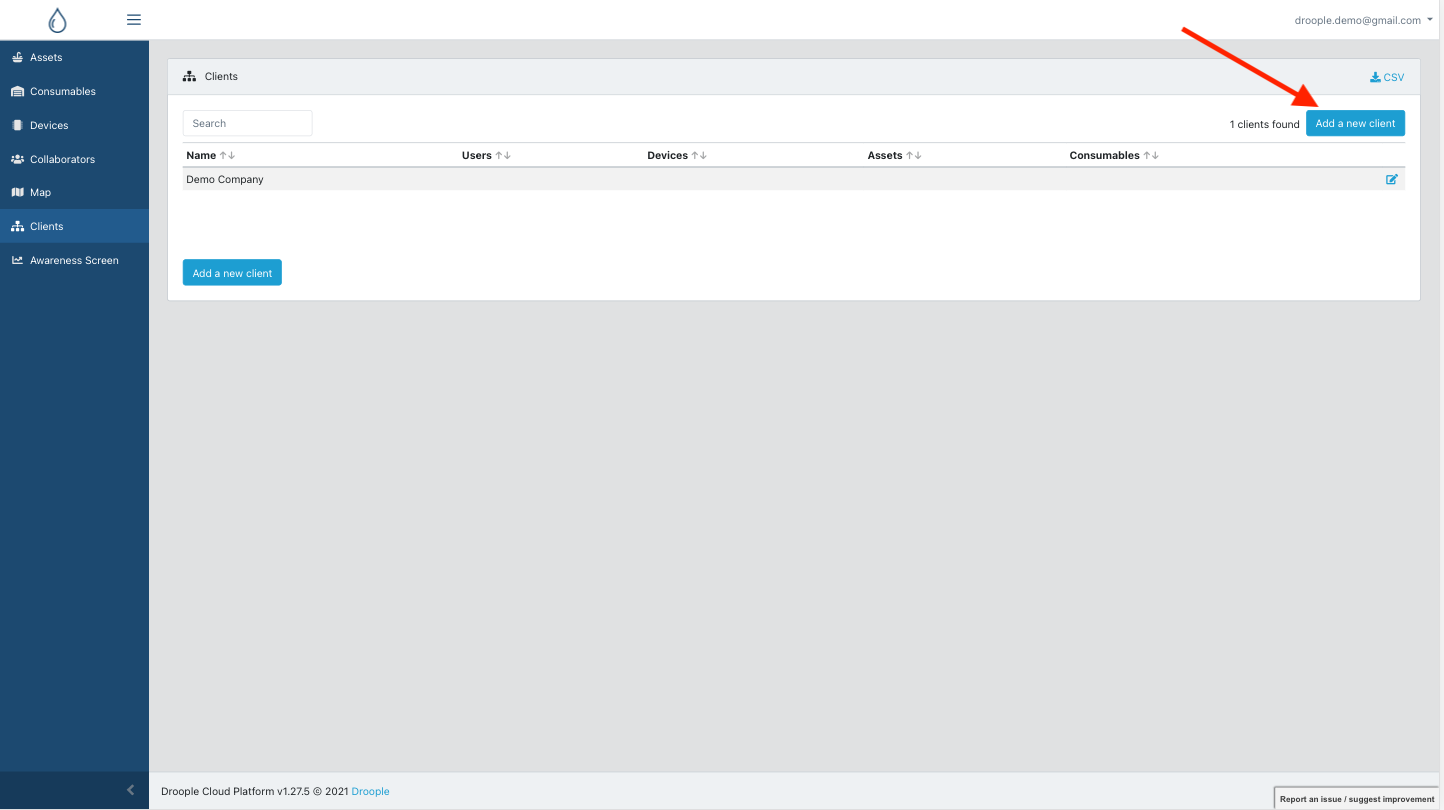
Once you are on the “client” page, click on the “Add a new client” button situated on the right side of your screen.
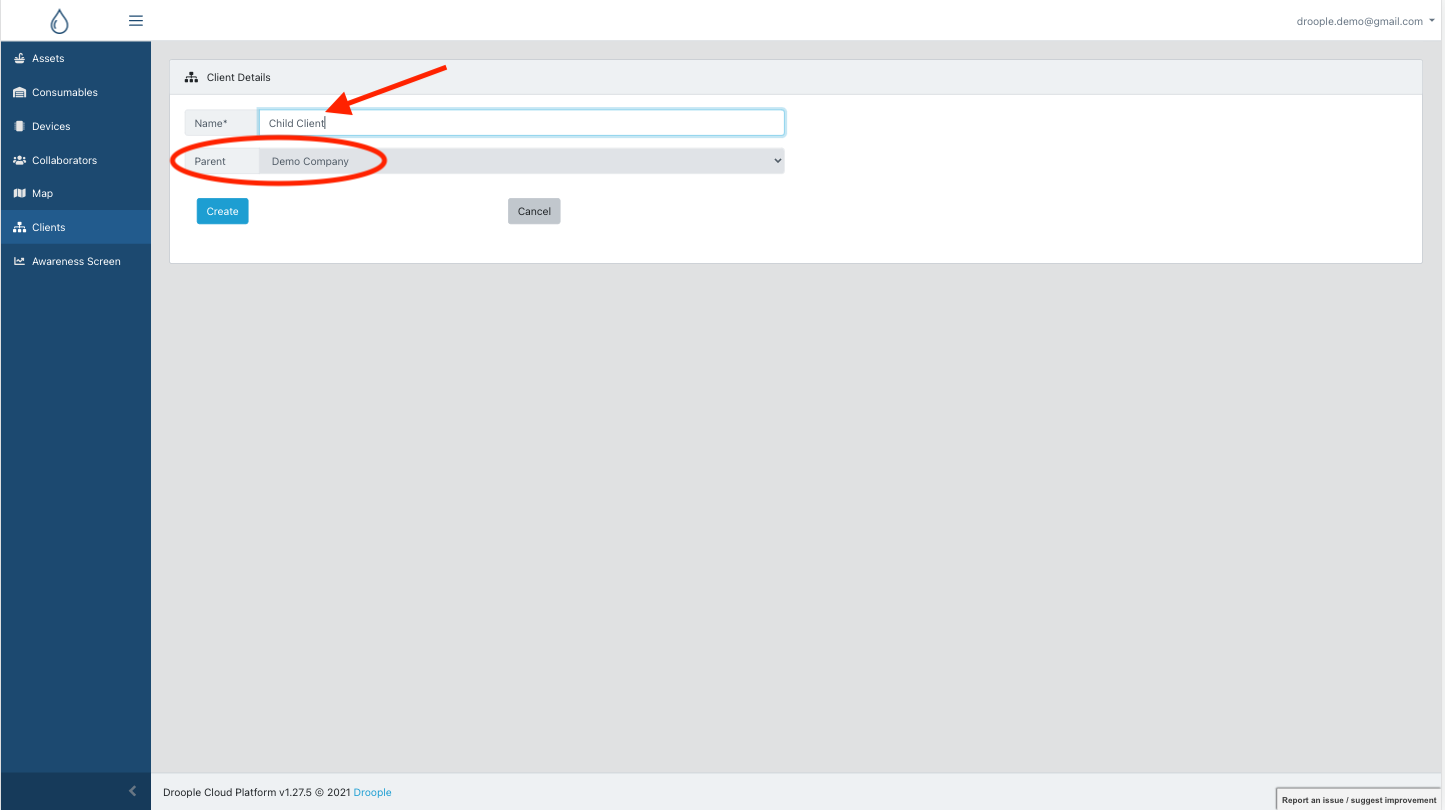
Then, just fill in the name of the client you want to add, it will be automatically linked as a “child” client under your “parent” account.
That's all! If you go back to the “client” page by clicking on tab on the left side, you will see your newly created client and you can always manage these child clients by clicking on little icon on the right.
Configuring your asset
To configure a new asset, please refer to the Quick Start Guide.
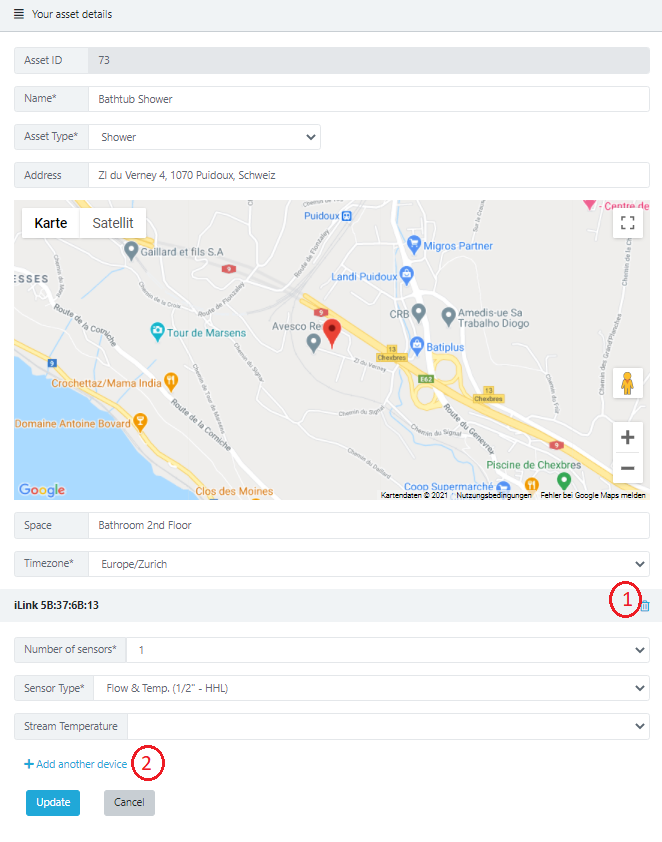
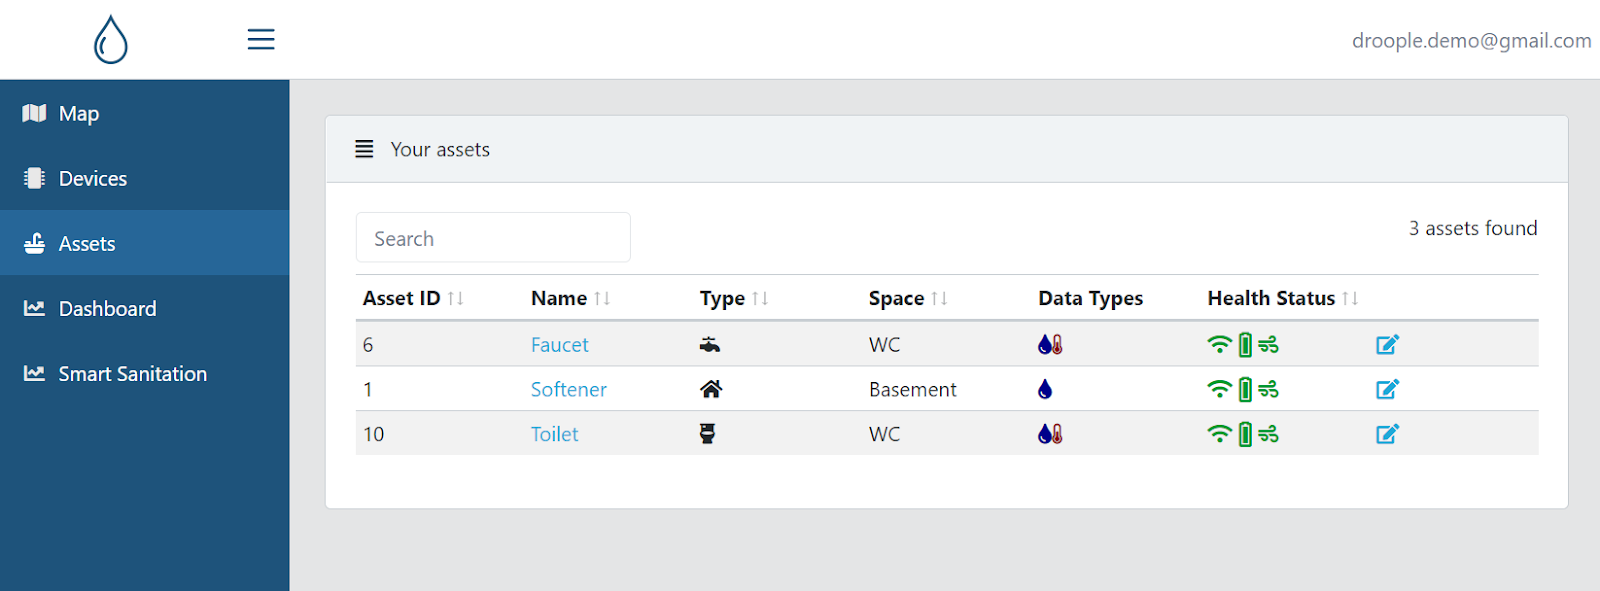
To edit an existing asset, go to the Assets tab and click on the edit icon

-
To detach (remove) a device previously connected to an asset, click on the delete icon next to the iLink name in the asset edition view
-
To attach a new device to the asset, click on “Add another device” and select a device from the list. Note that the list only displays devices that have already been registered with your account and that are currently not attached to any other asset.
Visualizing your assets data
To visualize your assets data, you can either click on Dashboard which will display the first asset you have configured, or go to the Assets tab on the menu and click on the asset name you want to display.
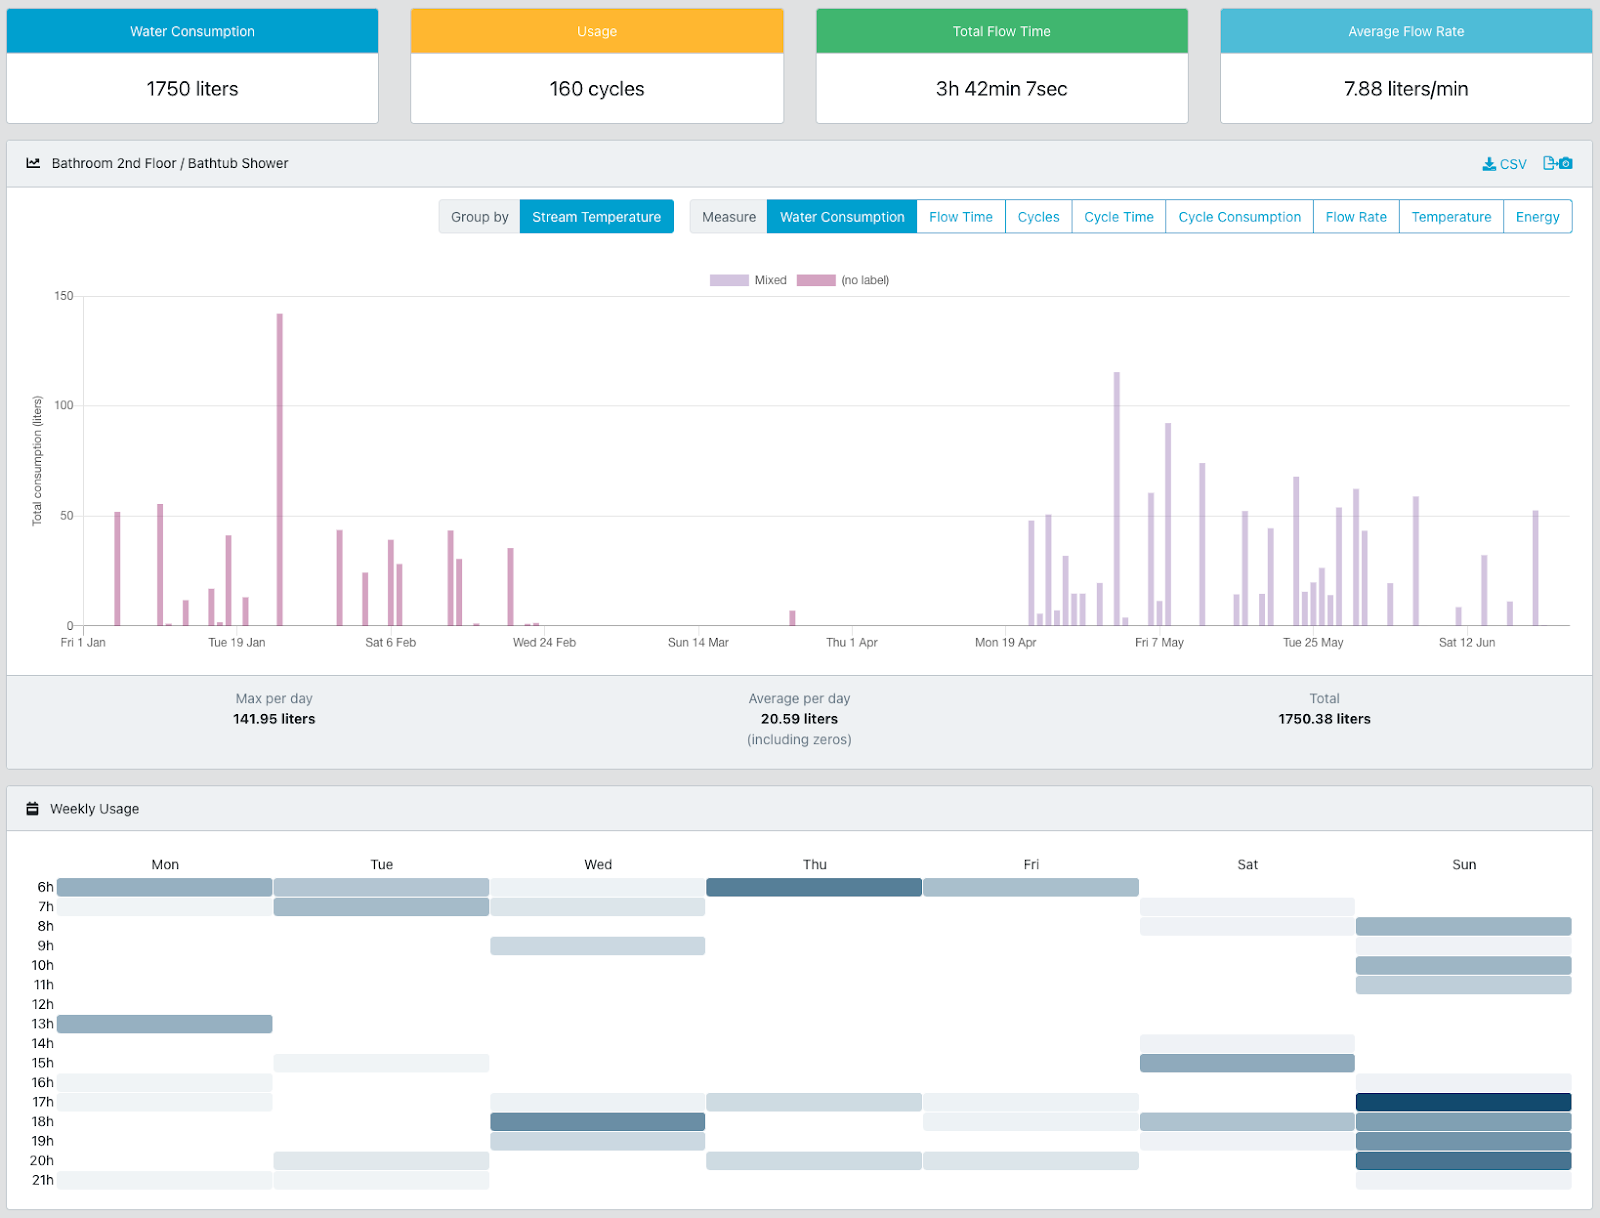
On the Dashboard, you can see:
-
The name of the asset shown
-
A view selection toolbar, which let you choose between:
a) Last 24 hours, grouped by hour
b)Last 7 days, grouped by days
c)Last 30 days, grouped by days
d)Last 12 months, grouped by months
e) A custom observation period and precision. If you select this option, you will need to enter your custom parameters in the top menu bar. -
A Key Performance Indicator list on top of the page with
a)The total flow quantity (volume of water) that was measured through all the sensors connected to the asset during the currently observed period.
b)The last recorded temperature that was measured through all the sensors connected to the asset during the currently observed period. If several temperature sensors are connected to the asset, the average value is displayed.
c)The total flow time, which is the amount of time during which the water has been flowing through all the sensors connected to the asset during the currently observed period. If several flow sensors are connected to the asset, the sum is displayed.
d)The average flow rate over the observed period. This corresponds to the measured flow quantity over the flow time.
e) (For Mono version only) The total amount of cycles counted during the observed period. -
Historical data plots displaying the above-mentioned metrics over time.
If several sensors are connected to the asset, the charts distinguish the different streams observed.
Monitoring two different streams of water connected to the same asset
To monitor two different streams of water connected to the same asset, you need an iLink Twin with two sensors connected to each water stream of the asset.
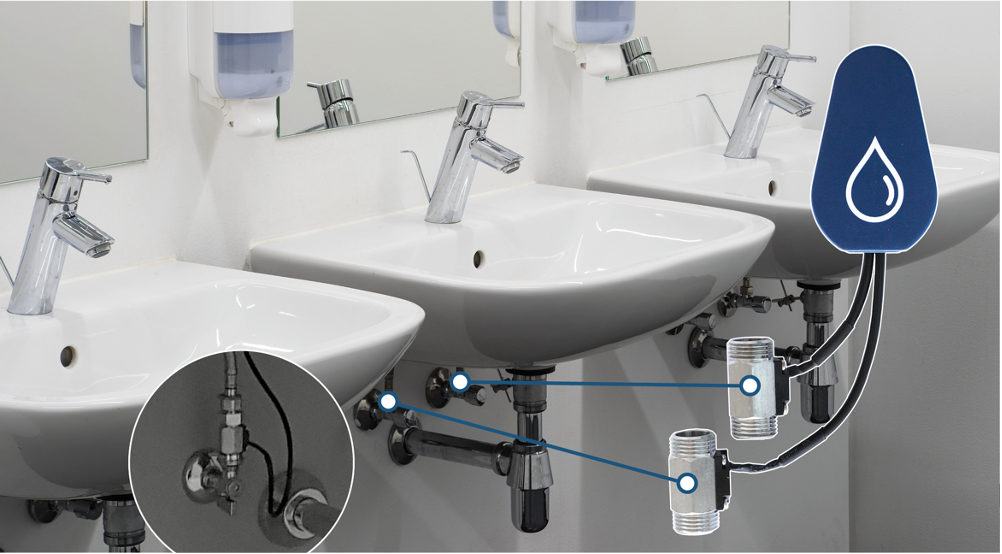
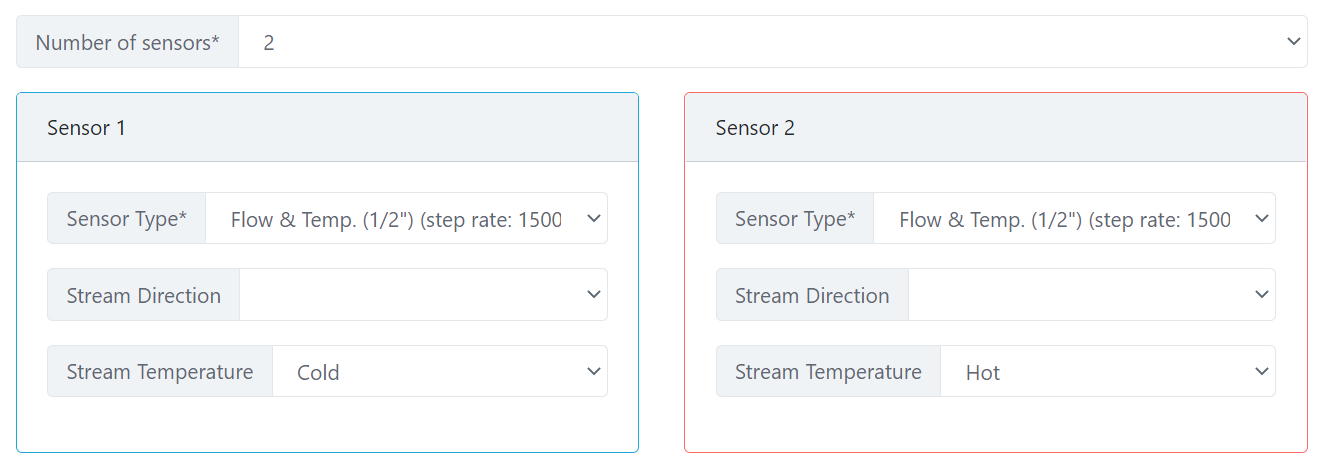
Then, on the asset configuration page, you can specify which sensor is measuring which water stream.
Make sure to write down which sensor (labeled “1” or “2”) has been plugged into each pipe. We recommend always plugging sensor 1 to Cold and sensor 2 to Hot (as they are colored accordingly). This helps to prevent mistakes when configuring your asset.
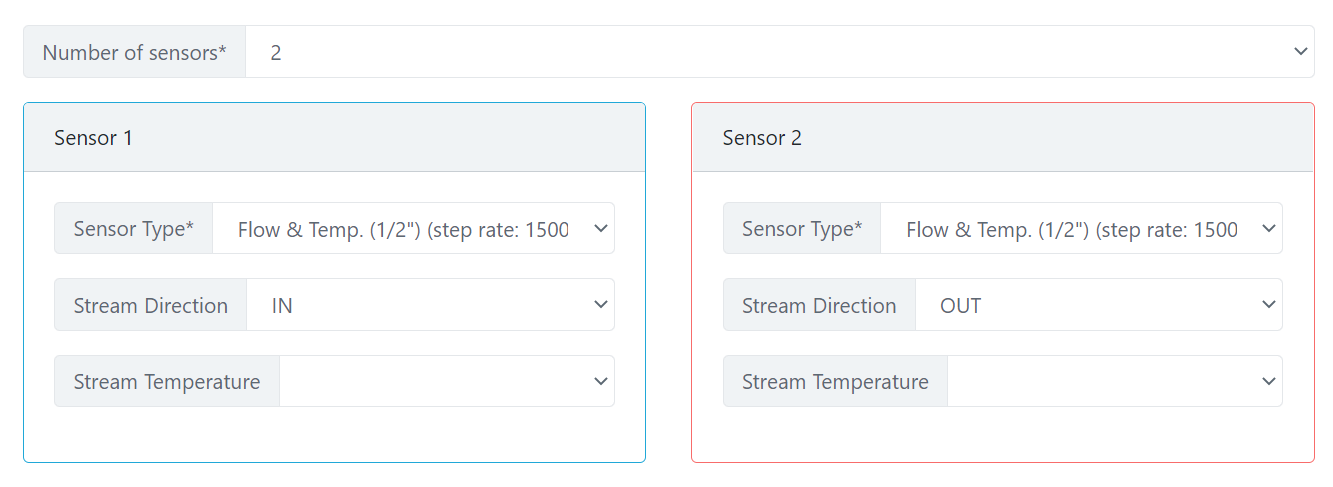
For water treatment assets like filters, use the IN and OUT Stream direction property to distinguish the water coming inside the filter from the treated water going outside of the filter.
Avoid using the stream direction or temperature fields if not needed (e.g. for a toilet).
Monitor and manage your asset consumables
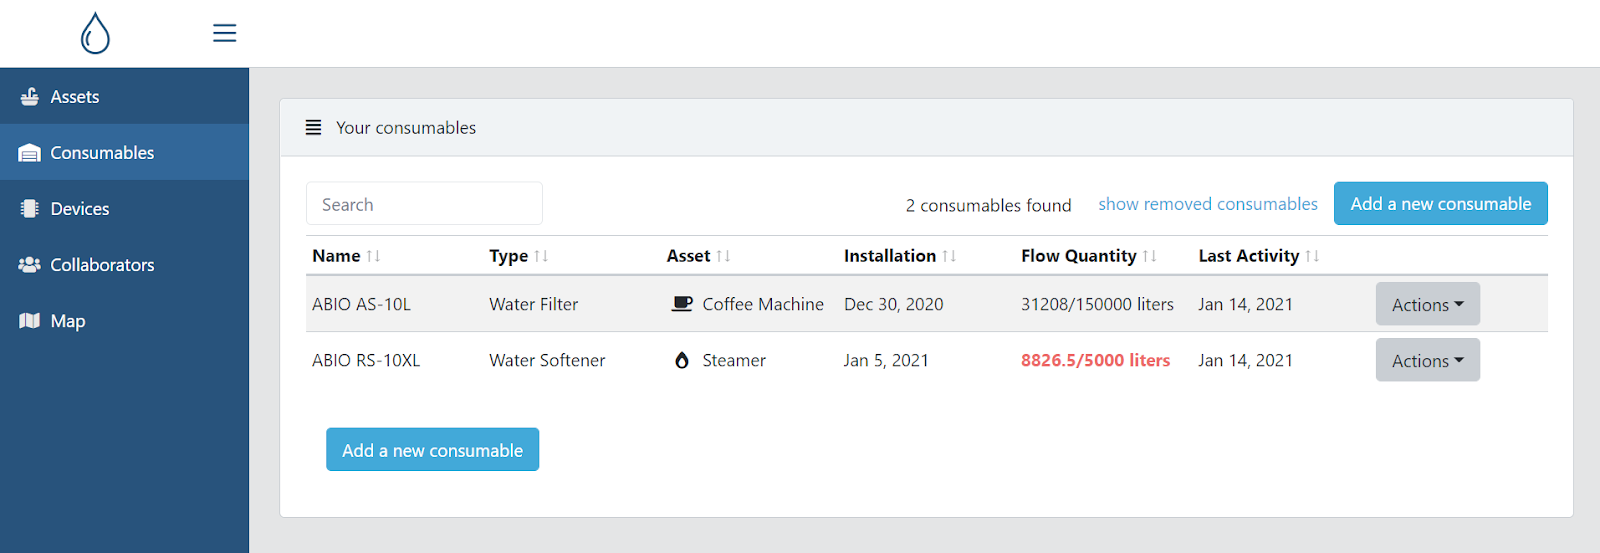
The consumables view allows you to monitor and manage your asset consumables. A consumable is something connected to an asset whose lifetime depends on the flow quantity that was consumed or processed (e.g. the salt for a softener, or a filter cartridge). Consumables which have exceeded their capacity are highlighted in red.
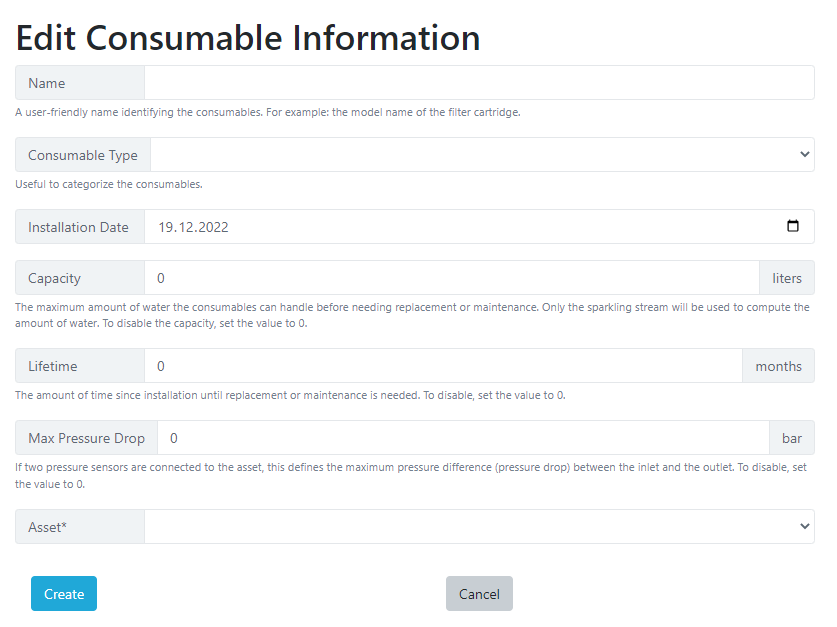
Each consumable has the following characteristics:
-
Name: a user-friendly name identifying the consumable. For example: the model name of the filter cartridge.
-
Type (optional): the type is useful to categorize the consumable. Example values could be: Salt, Sediment Filter Cartridge, Reverse Osmosis Membrane Cartridge,...
-
Installation date: when the consumable was installed
-
Removal date: when the consumable was removed. Currently installed filters do not have a removal date.
-
Capacity: the maximum amount of water the consumable can handle before needing replacement or maintenance. To disable the capacity, set the value to 0.
-
Lifetime: the amount of time since installation until replacement or maintenance is needed. To disable, set the value to 0.
-
Max Pressure Drop: if two pressure sensors are connected to the asset, this defines the maximum pressure difference (pressure drop) between the inlet and the outlet. To disable, set the value to 0.
-
Asset: the asset to which the consumable relate
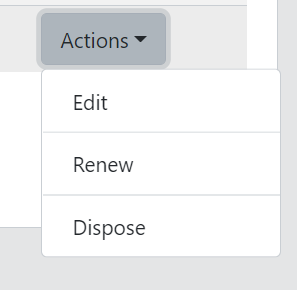
For each consumable, you find an Actions menu to perform several operations:
-
Edit the consumable details such as installation and removal date, as well as the maximum capacity.
-
Dispose the consumable: this operation sets the removal date of the consumable to the current date of the day, moving it to the removed consumables list. This operation is performed when the user removes the consumable without installing a new one.
-
Renew the consumable: this operation disposes the consumable by setting its removal date to the current day (if not already removed) and creates a new consumable with the same characteristics (name and capacity) but with an installation date set to the current day. This operation is performed when the user replaces the consumable of the asset.
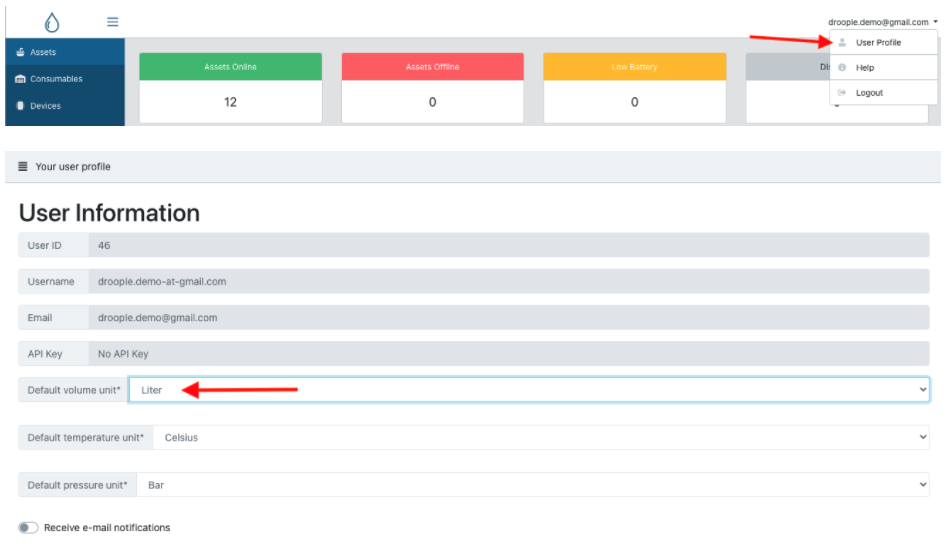
Changing the unit system to US Customary Units (US gallons and °F)
To change the unit system from SI Units (liters and °C) to US Customary Units click on your e-mail address on the top right corner of the screen and then select the default volume.
- To attach a new device to the asset, click on “Add another device” and select a device from the list. Note that the list only displays devices that have already been registered with your account and that are currently not attached to any other asset.

User Management
You can also create a new user if you need to have more people to access your data.
How to do that?
First, you need to log into your account. Then, once on the landing page, click on the "Collaborators" tab on the left of your screen.
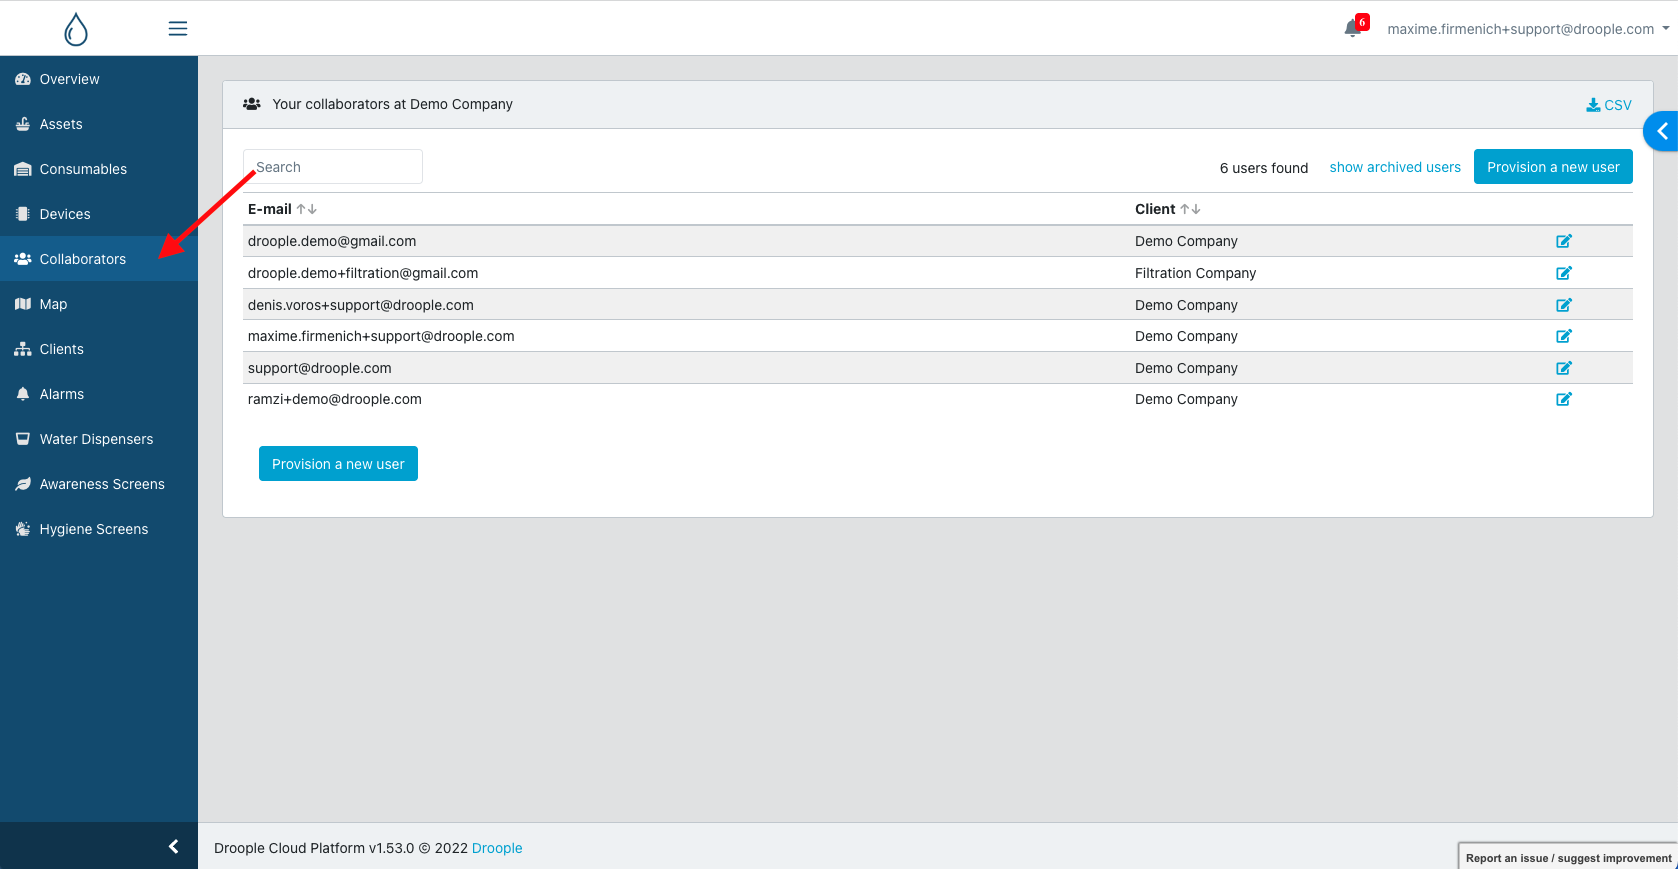
Once you are on the “Collaborators” page, click on the “Provision a new user” button situated on the right side of your screen.
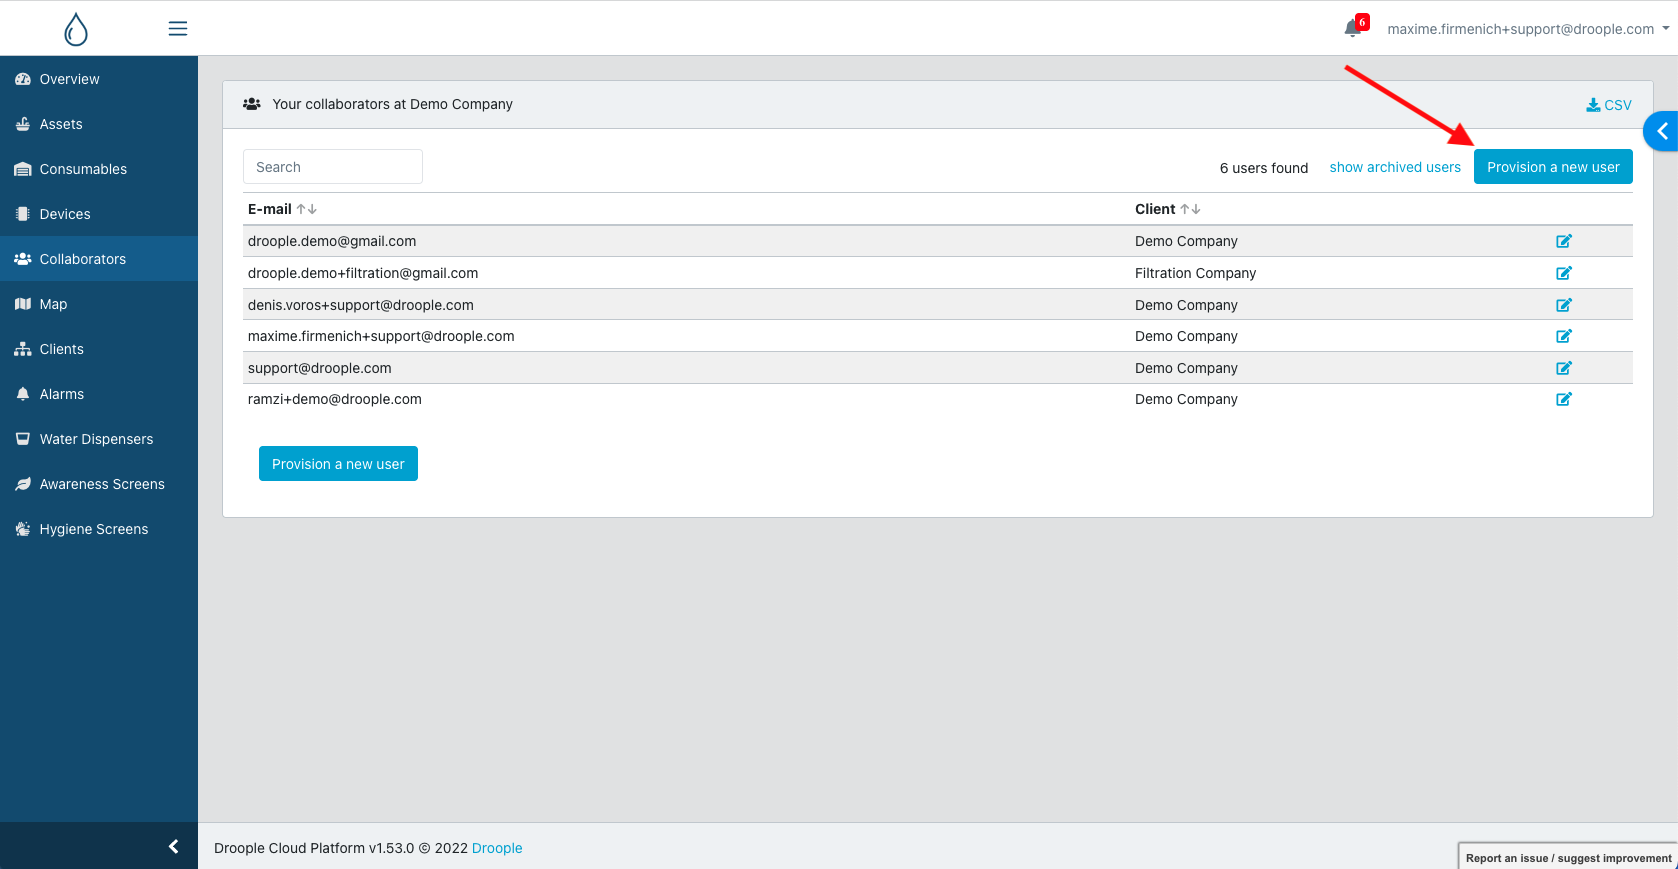
Then, just fill in the email from the person you want to add and choose the right client to which it needs to be linked.
Then, click on "Create".
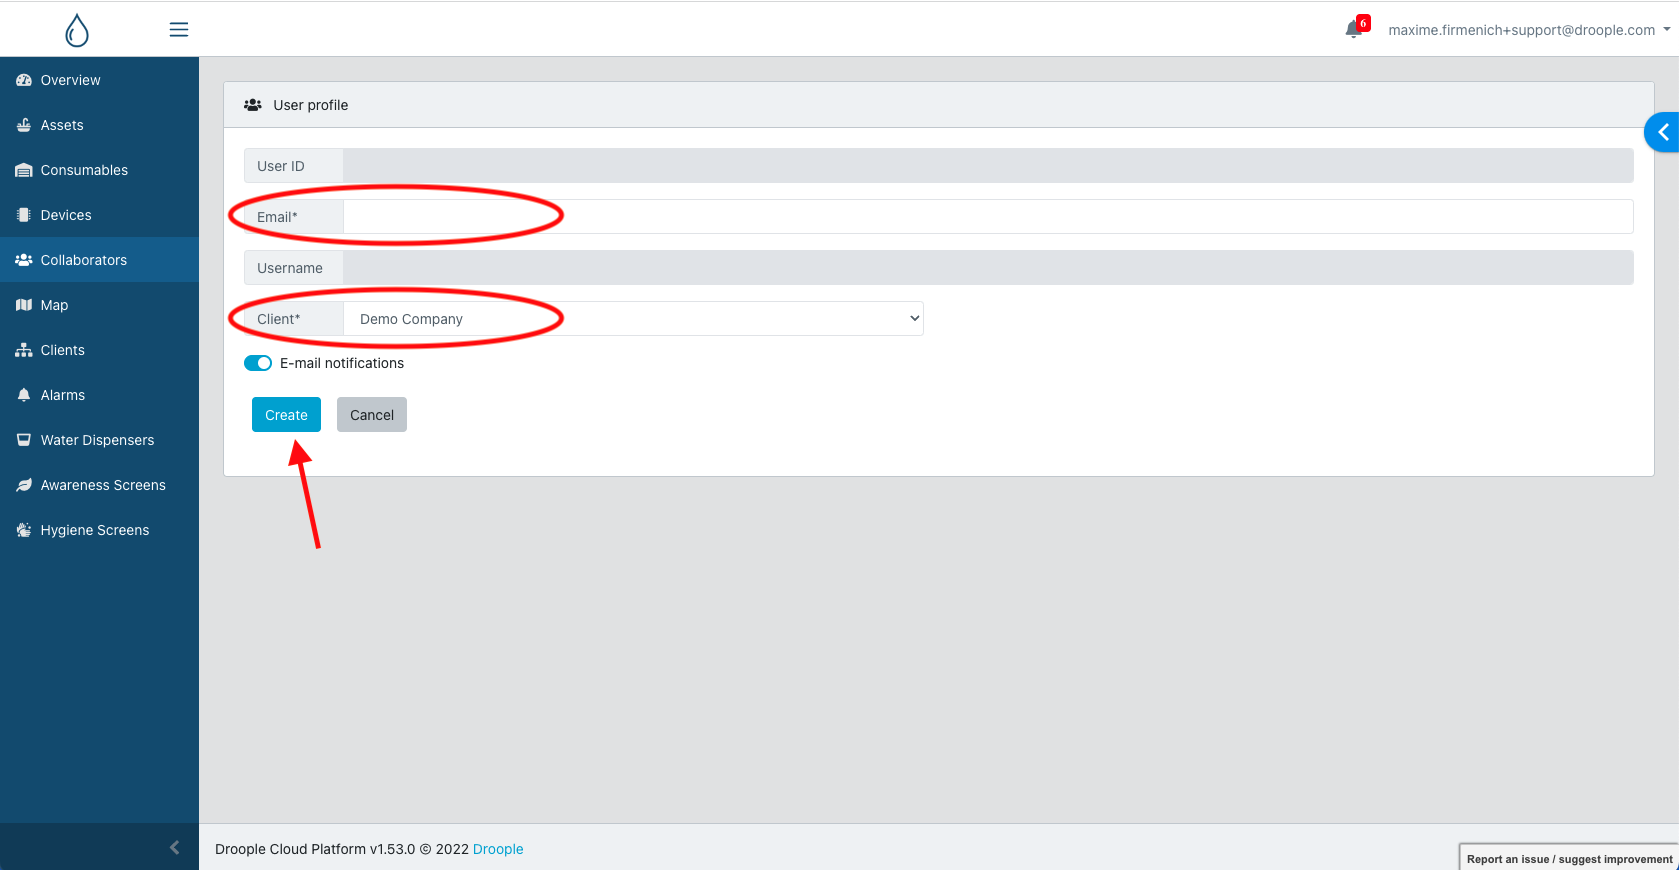
The person can then go to the login page of the platform and create its account and choose a password.
It's done!
Locating your assets on a map and monitoring your devices health status
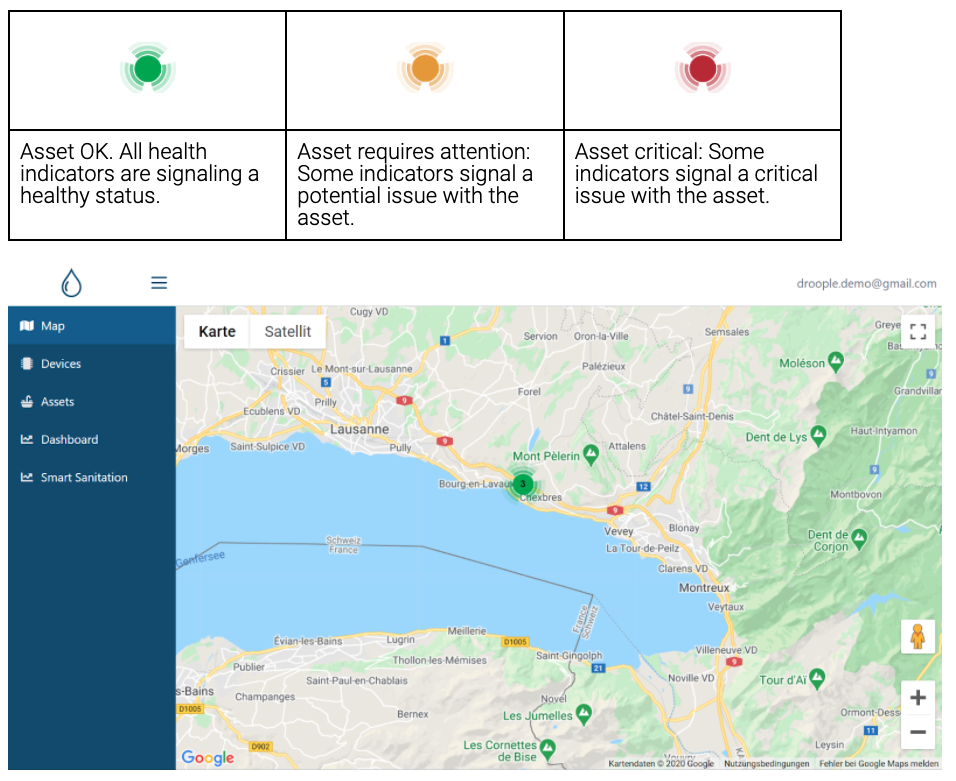
You can use the Map view to visualize your assets on a map. Assets in the same area are grouped together, and the number of assets grouped together is shown on the cluster icon . The color of the cluster icon indicates the worst asset health status in the group:
Download your data as CSV
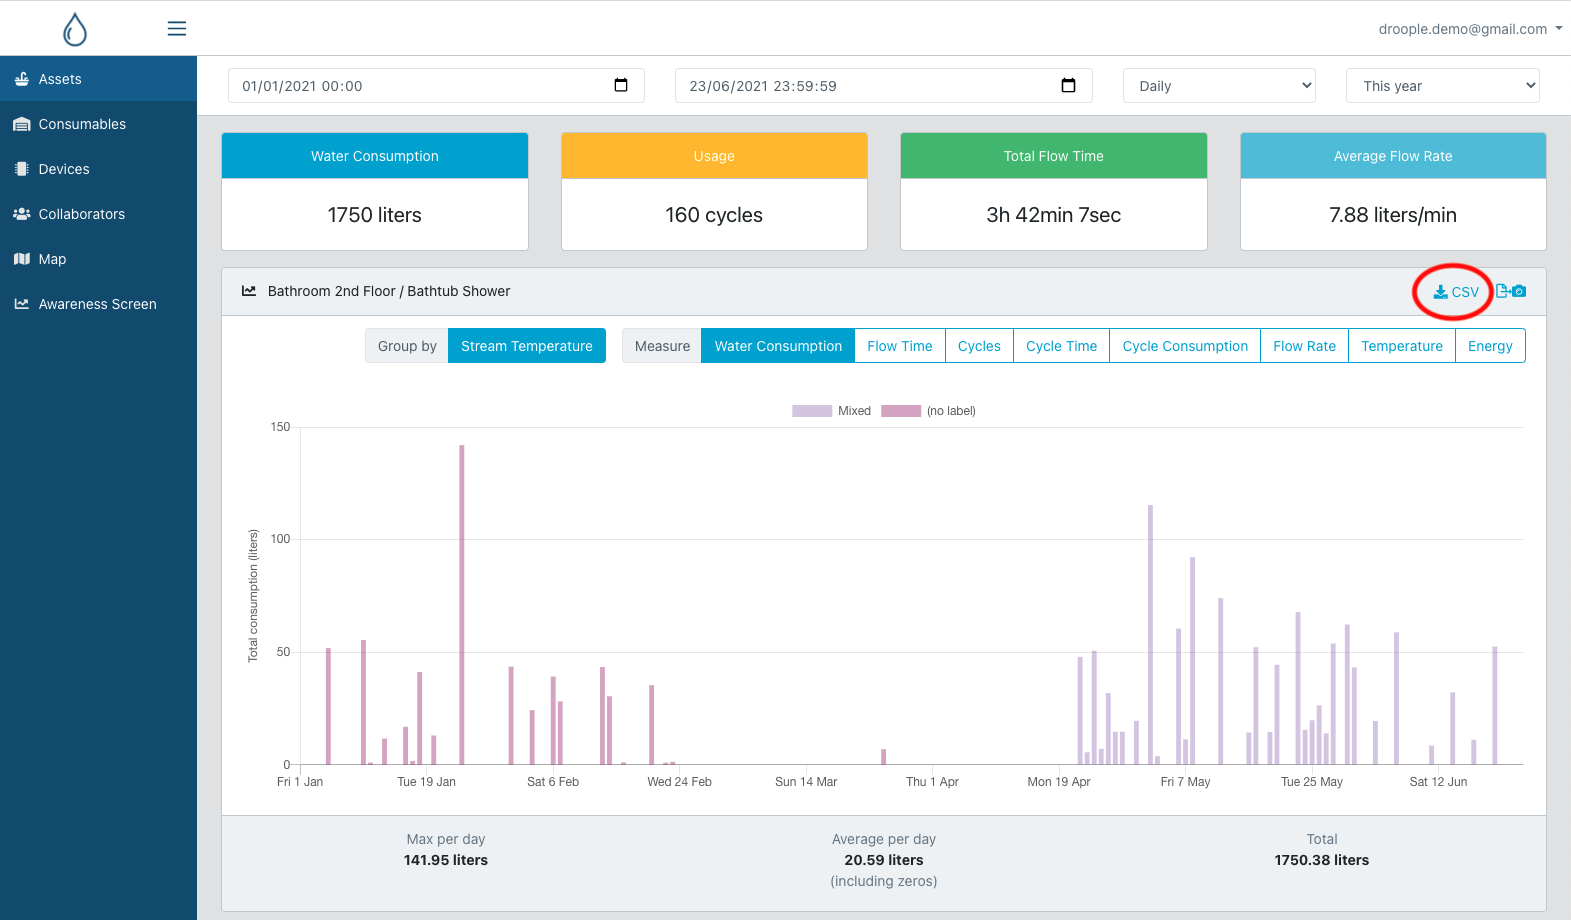
To download your data as CSV (comma-separated values), go to your asset Dashboard and identify the visual with the historical data you want to download. Click on the CSV icon and the file will automatically be downloaded to your computer. If needed, you can then open your CSV file with Excel.
Enabling and disabling email notifications when a device is not functioning properly or when a consumable reaches its end of life.
To enable or disable email notifications, go to your profile settings and enable/disable the notifications:
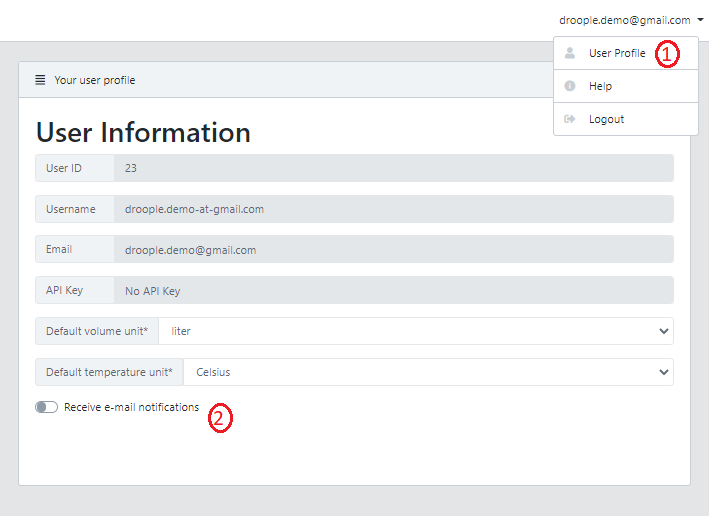
You receive a notification when:
- The battery of a device is low
- The connectivity with the platform has been lost
- A consumable has reached its maximum flow capacity
By default, notifications are turned off for all new users.
Archiving your assets
If you need to archive an asset that you don't use anymore, you can go on the edit page of the asset you want to archive and at the bottom right of the page, you will see a "Archive" button.
Simply click on it, confirm and you're done!
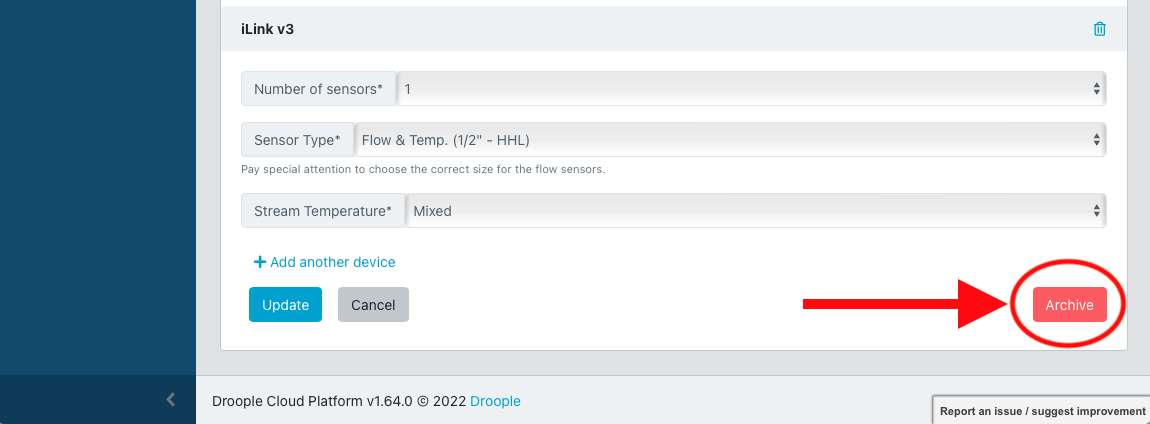
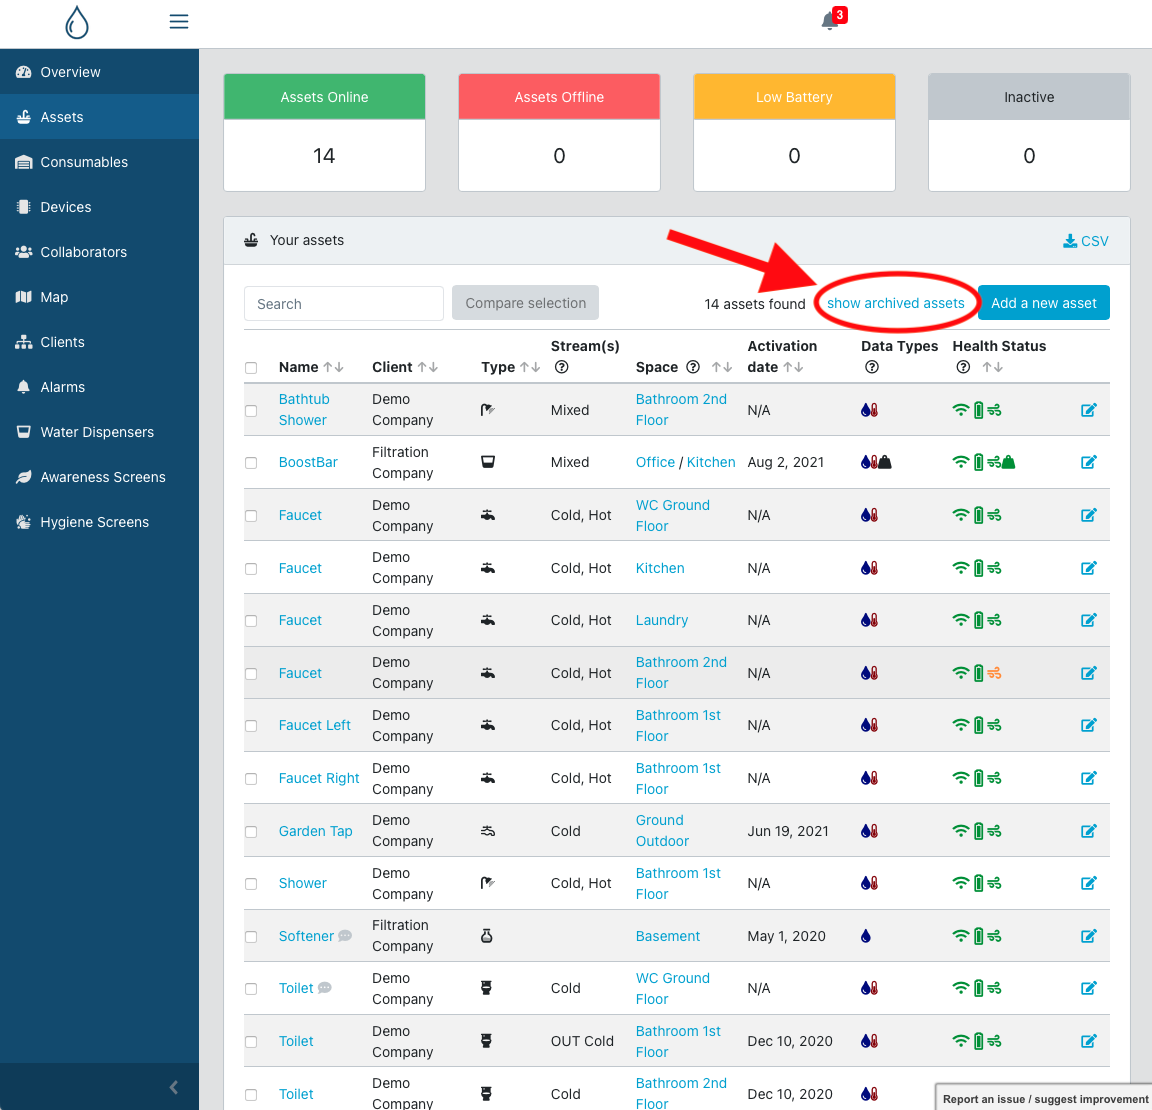
You can still access to the old data of an archived asset by clicking on the "Show archived assets" button on the Asset tab.
